
I'm going to open this with the bad news, so we're all on the same page: There is no simple guide for customizing SSRS reports. There's no "quick overview", and there really isn't a lot of official documentation. Unless the changes you're making are aesthetic only, you'll have your work cut out for you.
Here's the good* news: This process has been largely unchanged for over a decade, so when you (inevitably) run into an issue, there are resources (especially on epiusers.help) that you can turn to.
To kick off this series, I'm going to break down the easiest SSRS solution: The BAQ Report. You can build a BAQ Report with four simple steps two simple steps, one complicated step, and one that's just annoying.
Step One: Create a BAQ with the Data you need.
The data source for a BAQ Report comes from a Business Activity Query, or "BAQ". If you're not familiar with BAQs, I highly suggest you familiarize yourself with them. BAQs are one of the most potent tools for retrieving and/or manipulating data in your Epicor environment. To start, I'm going to show an example of a report I recently built: A custom Bill of Lading that includes shipped items and their component materials.

Above you can see the design for my Query. Since we're building this from scratch, we need the Customer ShipTo information, the OrderHed table, so we can get the PO Number, and the PartMtl table so that we can pull the subcomponents. Below are the Query results with the Tables / Fields in the headers.
Note: The engineering for this particular company is done at the part level. If they had a lot of modifications at the job level, I would have needed to link the JobMtl table instead of PartMtl.
")
You can see that a lot of the lines have duplicated data. That's alright, we'll fix that in the grouping on the actual SSRS Report. The important part is that we have all the data we need in the BAQ. As you can see in the Designer picture, there is a parameter added that filters this to a single ShipHead record based on the PackNum field. That will be important later.
Step Two: Creating the BAQ Report.
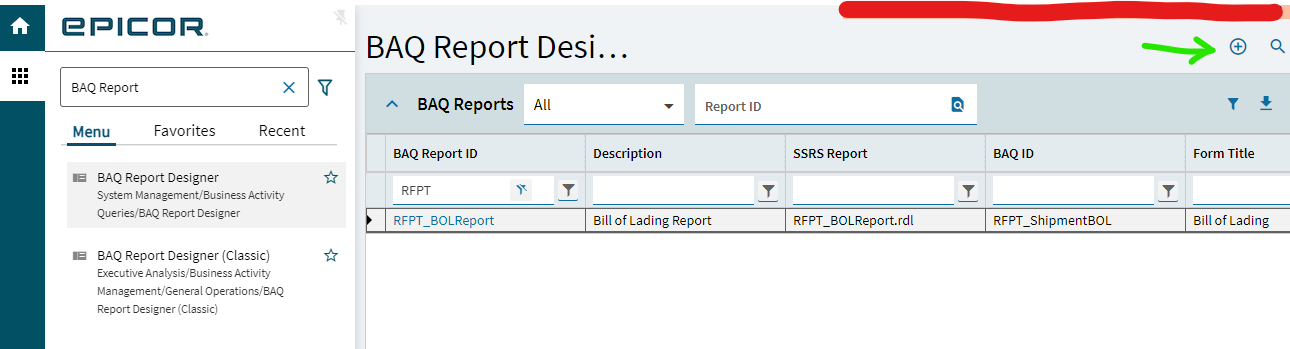
Next we'll head over to the BAQ Report Designer module and click the Add New button:
From there, we'll name our report and set the BAQ to use as the data source:
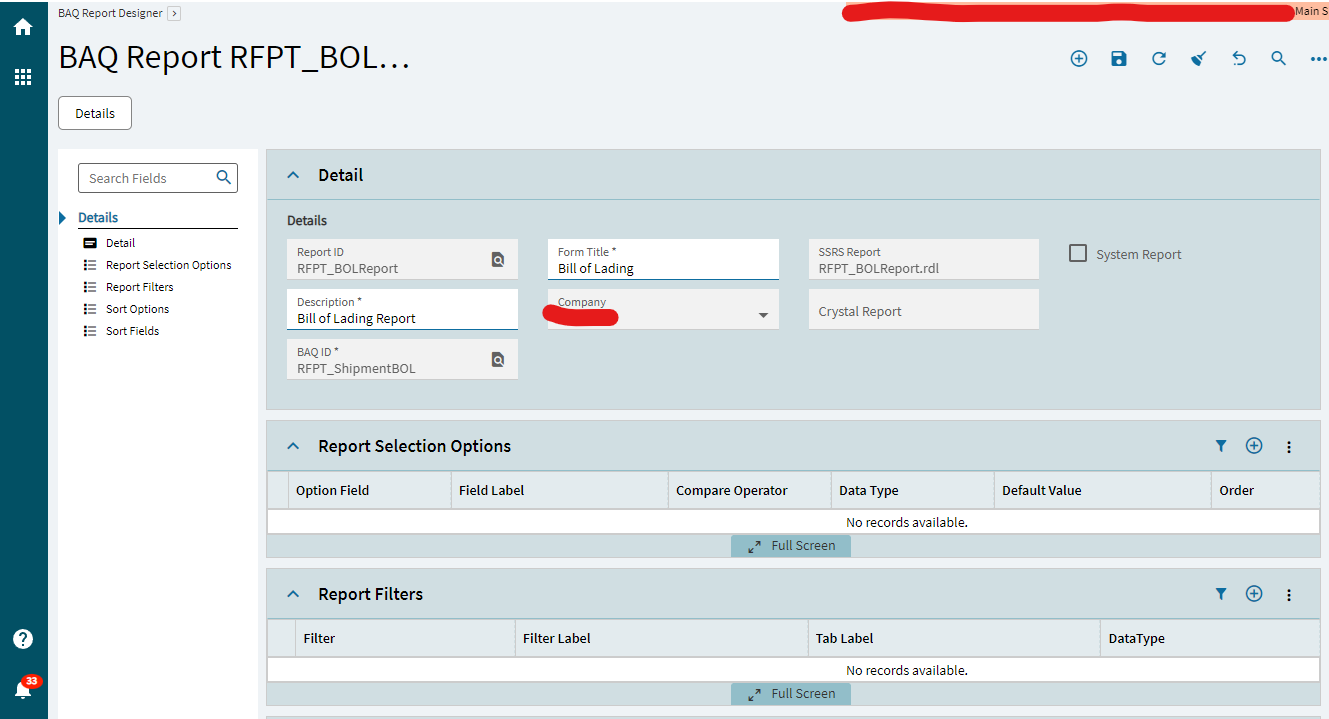
Two of the fields in the details panel are most important: The BAQ ID field, which tells the report to use the BAQ we designed in step one, and the Form Title field, which will populate the report header (this can be changed later).
Step Three: Designing the SSRS Report.
Now that we have defined the data and created the report, it's time to actually build the SSRS report. For this step, you'll need some software called Microsoft Report Builder. You can download it for free from Microsoft here. I'm not sure if this is a universal sentiment, but my own opinion is that this software is awful. But it's what we've got, so let's dive in.
Note: Since the Kinetic Client is on its way out, I'm going to do this using Kinetic in the browser, and the process you'll need to follow if you're using Kinetic in the Cloud. There are some shortcuts you can use if you're on-prem and / or working in the client, which I'll call out.
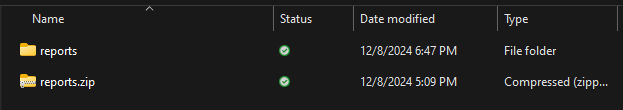
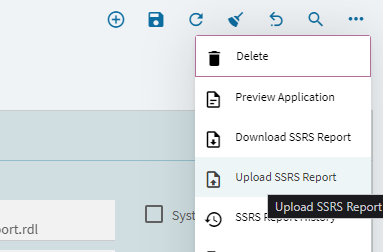
The first thing you'll need to do is get the SSRS Report file (.rdl). On the BAQ Report page, click the overflow menu (...) and select "Download SSRS Report". You'll be prompted to select a path to save the file, which will be named "reports.zip". I recommend putting this somewhere that's easy to access and in its own subfolder. When you later go to upload your completed reports, you'll need that reports.zip file. Once you've got that downloaded, go ahead and extract the .zip file.
Note: In classic, you can just download/upload the .rdl file directly. This is waaaay easier.
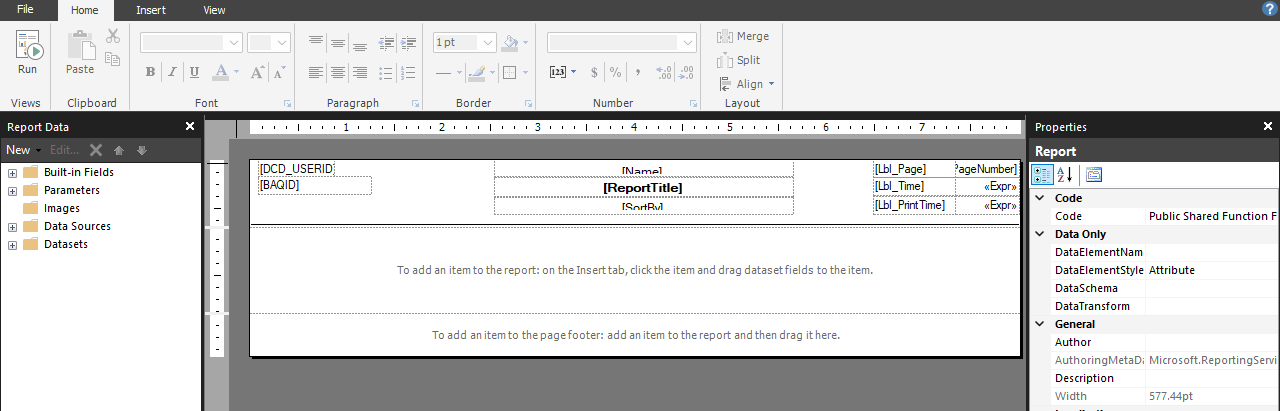
Once you've got that, dive into the folders until you find your RDL. Open it up, and you should see a (mostly) empty SSRS Report.
I won't go into all the ins and outs of Report Design here. I'll do a deep-dive into many of the tools you can use in Report Builder at a later date. For now, I'll show the basics on getting the data we added to a BAQ into something legible. Below are the steps that I follow to get the data I want in a decent format. There are definitely many ways to do this, but I find this to be the easiest.
WARNING: Report Builder likes to crash, occasionally. I recommend frequently hitting Save.
- To start, insert a new Tablix from the "Insert" tab.
- Drag the "Top Level" field into the Table.
- Don't worry about sizing, fonts, formats, or additional fields yet. Just get the initial setup knocked out first.
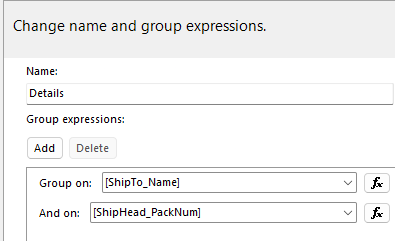
- Set the Row Group to Group on the fields I'm using.
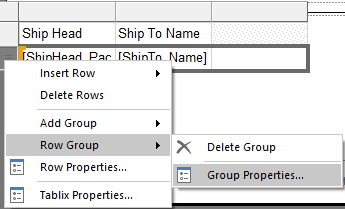
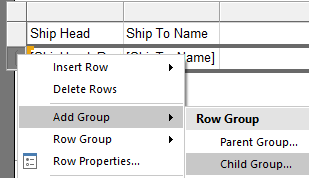
- Add a Child Group, grouped by PackLine.
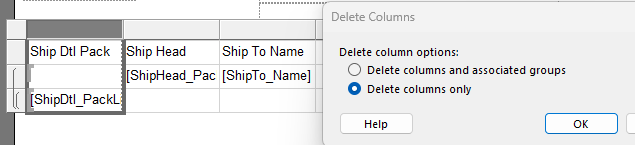
- Delete the automatically created column.
- Not required, but that extra column always gets me stuck in weird formats.
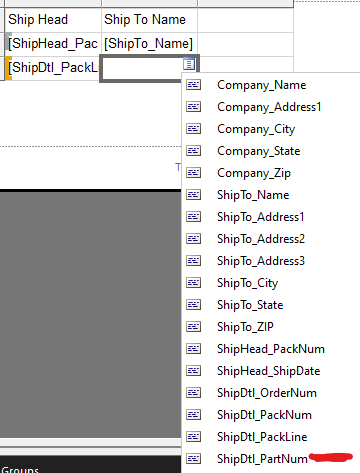
- Select the Column you want using one of the following:
- Click the Selector icon on the cell.
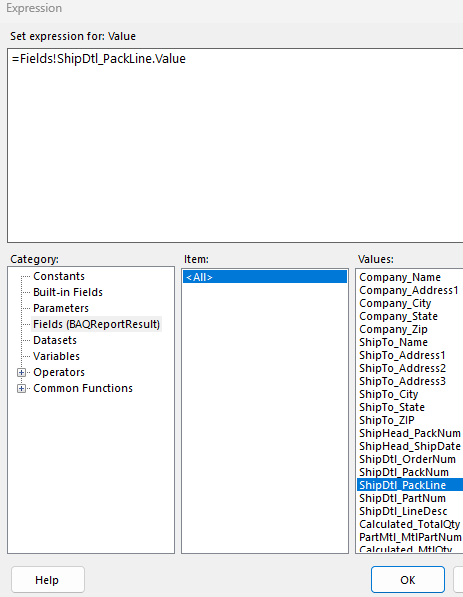
- Right-click the cell, choose "Expression", and add fields in the Expression editor.
- Now we have a group for the PackNum and a child group for the PackLine. Now we need a final sub-group for the Component parts from the PartMtl table.
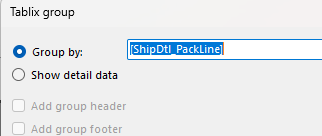
- Repeat the last few steps to add another child group, with the grouping on PartMtl_PartNum.
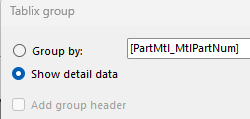
- For this group, select "Show Detail Data" when adding the child group.
- Delete the automatically created column again.
- Once that's done, the basic structure of your table is set. You can see the groupings in the brackets on the left.
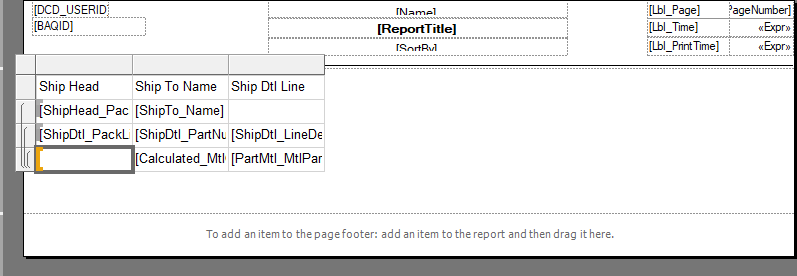
Now you can really get going on setting up the report the way you need it. Adding new columns, rows, headers, etc. I would recommend holding off on too much re-sizing until you have everything you need in the table, as you'll probably have to redo some work if you start re-sizing too early. Here's an example of my table once I have all the data I need added.
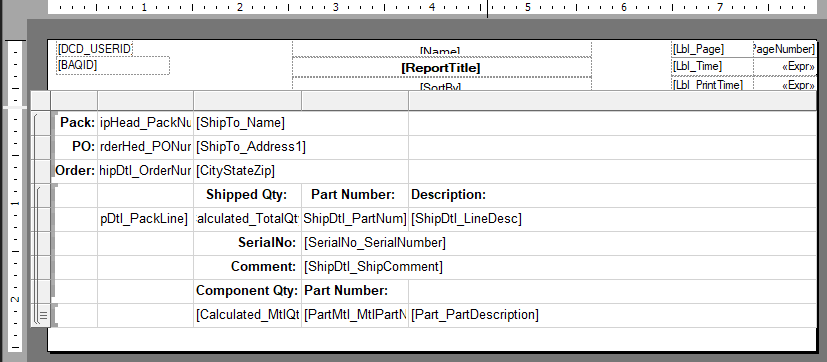
With this table, I'll get the top 3 rows for each ShipHead record. I'll have the next few rows for each line on the shipment (ShipDtl). I'll also get the last row for each component material attached to the Part on the ShipDtl (PartMtl).
Some additional details:
- As you can see in several instances, like in the "[ShipTo_Name]" cell, you may Merge cells across columns, similar to Excel.
- The headers for the Component Parts are in the Parent group to those rows. This will make sure the headers appear only once, regardless of how many component parts exist.
- The field "[CityStateZip]" is a concatenation of those fields on ShipTo. Expression below:
=Fields!ShipTo_City.Value & ", " & Fields!ShipTo_State.Value & ", " & Fields!ShipTo_ZIP.Value
- I have Visibility rules set on many rows. These are set in the expression editor in Row Properties (right click a row, select Row Properties).
- For example, The row containing "[SerialNo_SerialNumber]" is hidden if the length of the Serial Number is 0 characters.
- Rows are hidden if an Expression returns True. Expression for Serial Number below:
=iif( len(Fields!SerialNo_SerialNumber.Value) = 0, True, False )
Step Four: Uploading your report back to Kinetic.
Again, this one is way easier on-prem. But for Kinetic Cloud, here's how you get the report back into Kinetic:
- Save your report!
- Select the saved file, and either Copy and Paste it into that "reports.zip" file, or drag and drop it in.
- It will throw a warning letting you know the file already exists. Select "Copy and Replace" to overwrite the compressed file in reports.zip.
- If you saved your report under a different name, go ahead an make a copy with the original name. Or as an alternative, you'll need to change the Report File Name field to the new name in Report Style Maintenance for your BAQ report.
- Go back to the BAQ Report in BAQ Report Designer in Kinetic, and select "Upload SSRS Report" from the Overflow menu.
- Select your "reports.zip" file, and click "Upload".
- NOTE: It will not accept any file unless named "reports.zip".
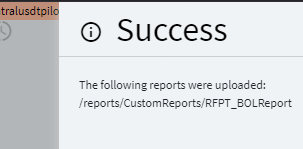
- If all goes well, you should get a slide-out message that your report was uploaded.
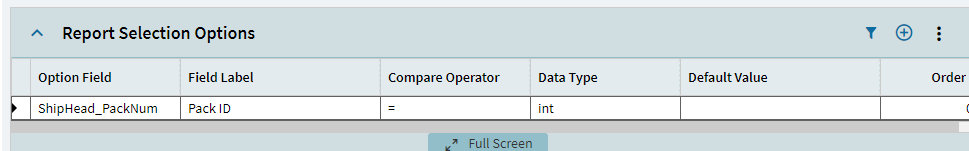
Step Five: Report Selection Options
This is pretty straightforward, especially if you're only filtering on one field. By default, the BAQ Report will ignore any parameters in your BAQ. It will keep other criteria, but it won't prompt you for Parameters. To get around that, set up Report Selection Options in the BAQ Report Designer. In my example below, I'm filtering on ShipHead.PackNum.
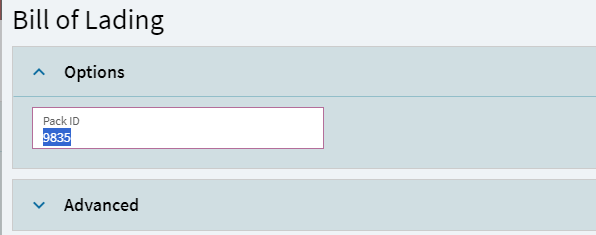
Now you can preview your report by selecting "Preview Application" from the overflow menu. It will have a field for you to add your parameters based on the Report Selection Options you set:
Then I hit Print Preview, and I clearly have some more formatting work to do (this is part of the reason I hate MS Report Builder).
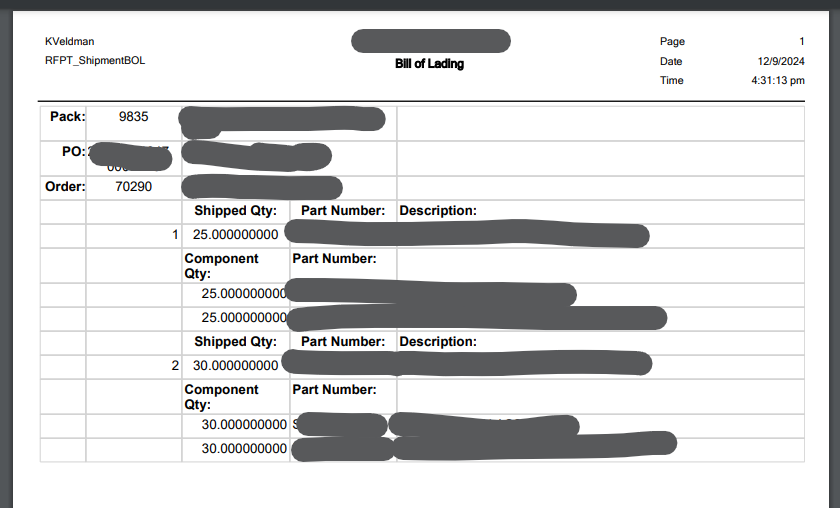
And that's all!
All your BAQ Data that you need, all presented in a PDF. Unfortunately, it isn't very pretty unless you spend some time fiddling with these reports. To make it worse, there isn't a great way to test them without uploading them back to Kinetic. But if you need data in a printable format, these can be really useful. And, if you take the time, you can make them presentable for customer-facing reports, executive reports, and more.
Customizing SSRS Reports - Volume 1: BAQ Reports